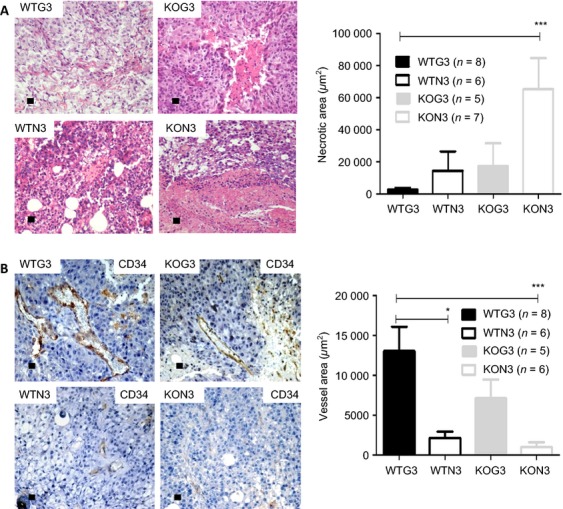
Figure 2.

Morphological differences evaluation by Hematoxylin and Eosin stain and Immunohystochemistry. (A) Analysis of necrotic areas by H/E and (B) vascular density by counting CD34-positive cells per area. The results were submitted to unpaired t-test with *P < 0.1 and ***P < 0.001. The “n” value was indicated in the figure and each bar represents the mean ± SE. Graph from a representative experiment.
