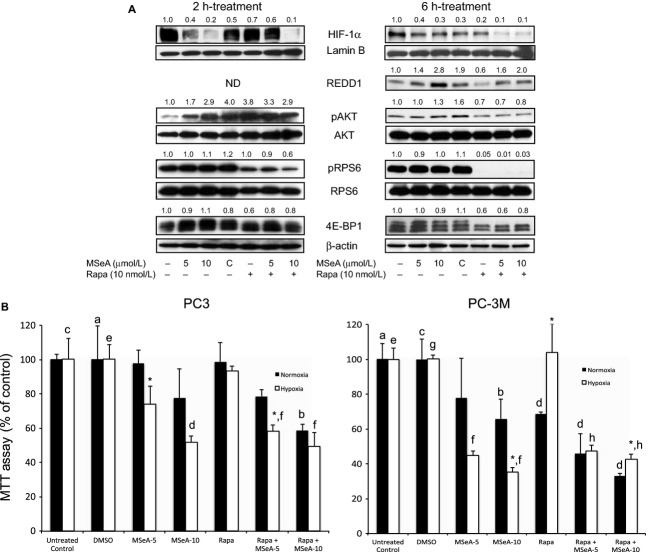
Figure 3.
(A) HIF-1α, REDD1, pAKT, pRPS6, 4E-BP1 levels in MSeA-treated PC-3M cells in presence of rapamycin in hypoxia. PC-3M cells were pretreated for 1 h with rapamycin (10 nmol/L) before being exposed to 2 or 6 h treatment with MSeA. Nuclear extracts were processed for HIF-1α and Lamin B xpression levels and cytosolic fractions were analyzed for REDD1, native AKT, pAKT, pRPS6, 4E-BP1 and β-actin protein levels. MSeA reduced HIF-1α levels in a dose-dependent manner but in the presence of rapamycin moderate resistance occurs at the lower dose of MSeA (5 μmol/L) at 2 h. At 6 h, HIF-1α levels were considerably reduced with the combined treatment. REDD1 levels were clearly upregulated by MSeA but downregulated by rapamycin treatment in 6 h under hypoxia. MSeA treatment of PC-3M cells in presence of rapamycin was able to rescue the REDD1 reduction. MSeA treatment clearly induces pAKT levels after 2 h and continues up to 6 h in hypoxia. However, in the presence of rapamycin, an increase was not evident at either time point compared to DMSO control. MSeA also increases levels of pRPS6 moderately (2 and 6 h) and rapamycin strongly blocks phosphorylation on RPS6 compared to DMSO control (C) at 2 h and was completely eliminated by 6 h. At 2 h, the hyper-phosphorylated bands on 4E-BP1 are upregulated following MSeA treatment but in the presence of rapamycin this band is less phosphorylated and completely disappears after 6 h combined treatment in PC-3M cells. ND: not determined. (B) Growth inhibition of prostate cancer cells treated with MSeA in the presence or absence of rapamycin when examined under normoxia or hypoxia. a versus b (P < 0.05), *N versus H: P < 0.05, c versus d, e versus f and g versus h: P < 0.01. The fold change in band densities of HIF-1α were normalized to the band densities of the respective Lamin B levels of the nuclear extracts in all samples. The fold change in band densities of pAKT and pRPS6 were normalized to the band densities of the respective native AKT and RPS6 and to β-actin levels. While for REDD1, and 4E-BP1 the band densities were normalized to β-actin levels. HIF-1α, hypoxia-inducible factor-1 alpha; REDD1, regulated in development and DNA damage 1; MSeA, methylseleninic acid; DMSO, dimethyl sulfoxide.

