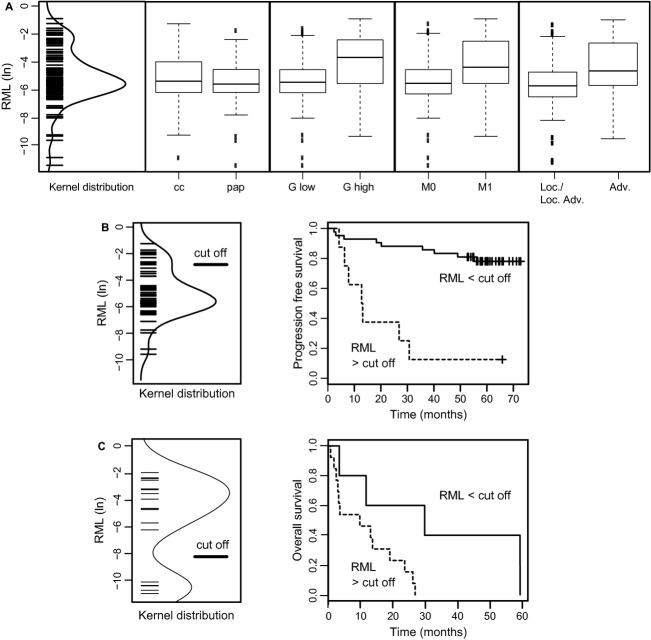
Figure 3.
(A) Distribution with kernel density estimation for relative methylation levels (RML) in natural logarithmic scale as detected in all tumor samples (left panel). Box plot analyses showing tumor subset-specific relative methylation levels for clear cell (cc) or papillary (pap) histology, low-(G ≤ 2) or high-grade (G > 2) tumors, negative (M0) or metastasis-positive (M+) patients and localized or locally advanced (pT ≤ 3, N0, M0) or advanced (pT > 3 and/or N+, M+) disease (B) Distribution of relative methylation values in the survival analysis group with kernel distribution and indication of the statistically optimized cutoff value of RML of 5.9% (−2.85 in the natural logarithmic scale, left panel). Kaplan–Meier plot analysis illustrating relative progression-free survival of all renal cell cancer (RCC) patients following dichotomization (right panel). (C) Distribution and cutoff level of relative methylation levels observed for the therapy group (left panel) and Kaplan–Meier plot analysis (right panel) showing relative overall survival of patients under targeted therapies for treatment of advanced disease.

