
Figure 5.
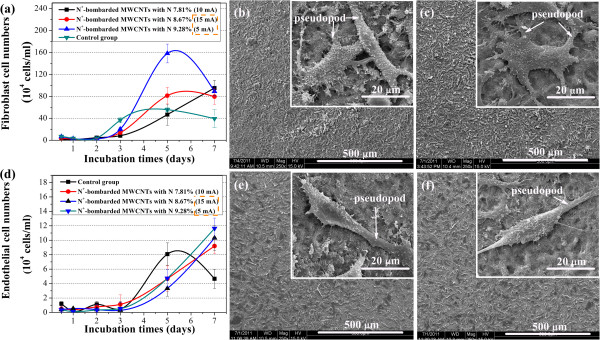
Direct contact measurements and calculations of cell viability. (a) L929 mouse fibroblast cell numbers on the surfaces of different materials vs. incubation time; SEM images of L929 mouse fibroblast cells fixed on the surfaces of N+-bombarded MWCNTs with nitrogen contents of (b) 8.67% and (c) 9.28%. (d) EAHY926 endothelial cell numbers on the surfaces of different materials vs. incubation time; SEM images of EAHY926 endothelial cells fixed on the surfaces of N+-bombarded MWCNTs with nitrogen contents of (e) 8.67% and (f) 9.28%.