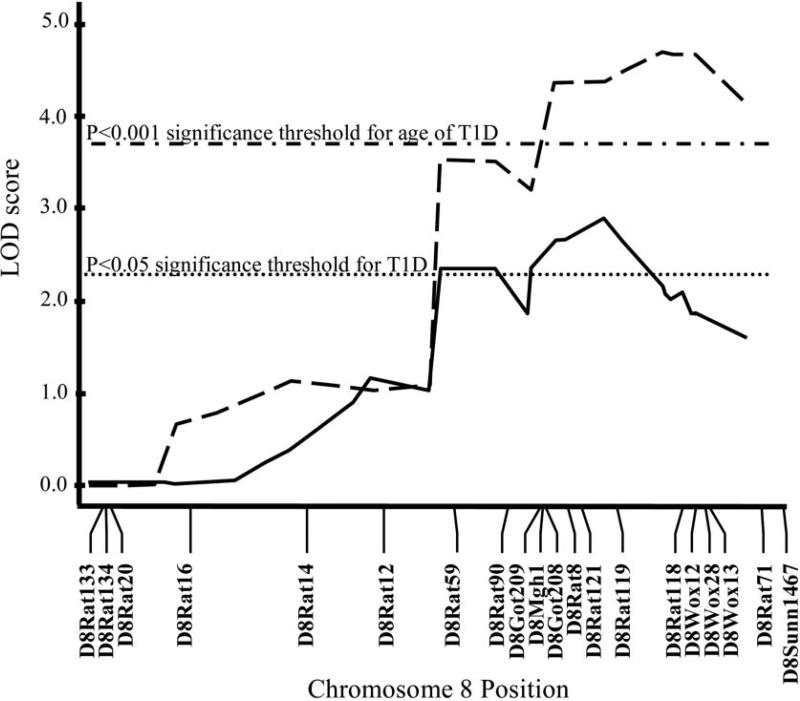
FIG. 3.
Linkage analysis using an F2 (BBDP × BB.WF chromosome 8/13) intercross (n = 134), showing significant linkage with both type 1 diabetes (T1D, solid line) and age of type 1 diabetes onset (dashed line). LOD scores were calculated using Windows QTL Cartographer, version 2.5 (25). MAPMAKER/EXP, version 3.0 (23,24), was used to construct the genetic linkage map using the 18 microsatellite markers shown. LOD score thresholds were determined by permutation testing (n = 1,000 permutations) (27). Significant loci were defined as those that exceeded the 95th percentile (P < 0.05, dotted line) of permutation distribution, while highly significant loci exceeded the 99.9th percentile (P < 0.001, dash-dotted line). Highly significant linkage (>99.9% confidence) was reached with age of type 1 diabetes onset (peak LOD 4.72) between D8Rat119 (120.53 Mb) and D8Rat118 (123.89 Mb), and significant linkage (>95% confidence) was reached with type 1 diabetes (peak LOD 2.92) at D8Rat119.

