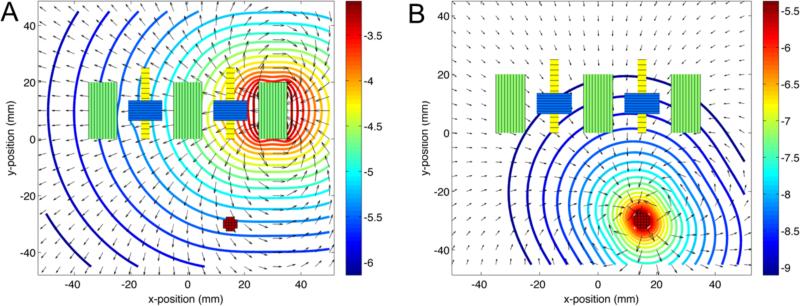
Figure 4.
Top view of the simulation setup with magnetic field magnitudes indicated by the contours in log10(T) and the field directions indicated by the arrows. A: Field from 30 mA in the right drive coil (450 turns) with both compensation coils on. B: Magnetic induction field from the mNP sample centered at a distance of 30 mm from the nearest fluxgate.

