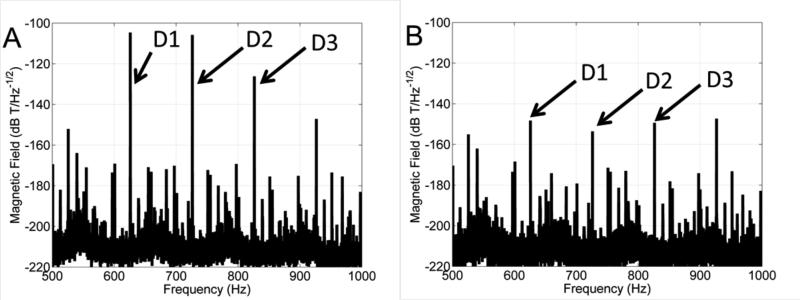
Figure 5.
Noise spectral density calculated using the Welch method. The noise spectrum is plotted without active compensation (A) and with active compensation (B). The spectral lines corresponding to the three drive coils are indicated by the arrows. The noise amplitude is 66, 36 and 26 pT RMS at 625, 725 and 825 Hz respectively.

