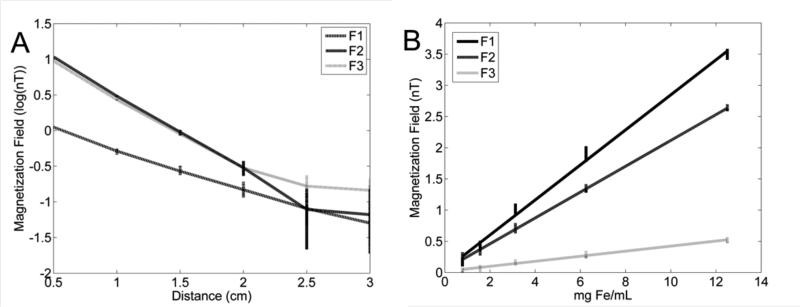
Figure 7.
A: Illustration of depth sensitivity. The sample was initially placed at 0.5 cm and moved 0.5 cm every 30 s. The data is plotted as log10 for all three drive coils and one fluxgate sensor. Differences in the magnetization field are significantly different until 2.5 cm. B: Concentration linearity. Samples were serially diluted and placed 0.5 cm from the sensor for 30 s. Linear regressions were performed on measurements and in all three cases R2 > 0.98 and p < 0.001.

