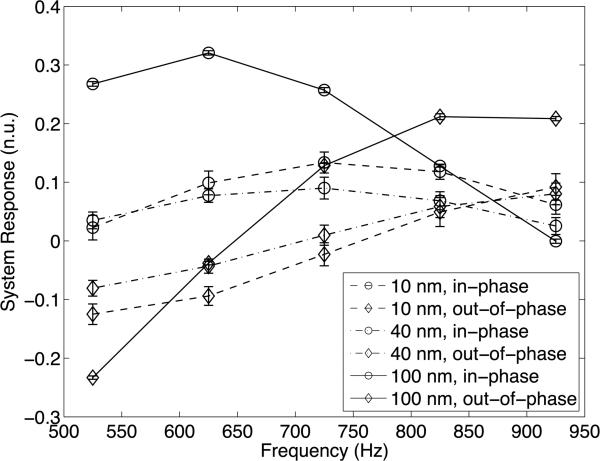
Figure 8.
System frequency responses for different sizes of mNPs. The frequency response of the system to mNP samples is shown over the frequencies from 525–925 Hz. The in-phase and outof-phase components are plotted separately for each of the mNPs. Error bars show the standard deviations of the measurements from 30 s readings processed at 1 Hz.

