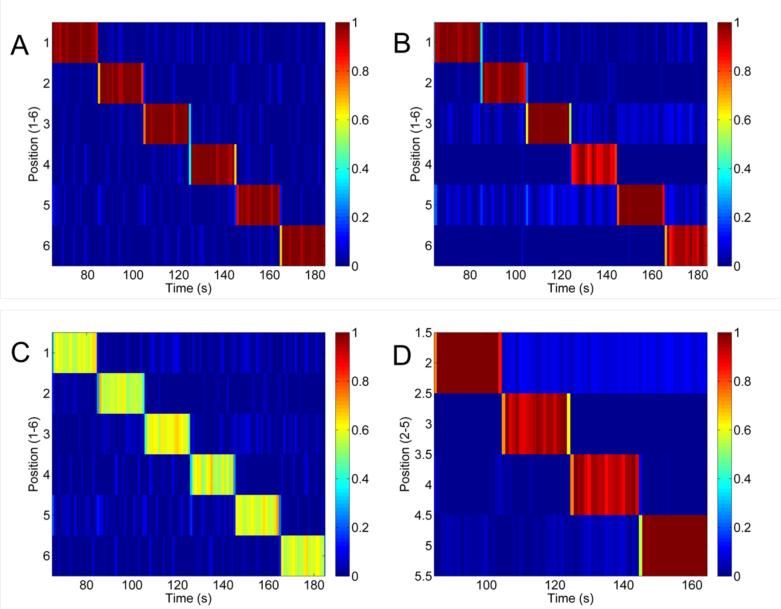
Figure 9.
Tomographic line images for evaluation of imaging CNR. A: Calibration image from data used to create the 6-voxel line image from a 12.5 mg Fe/ml mNP sample at 0.5 cm depth (CNR = 30). B: Line imaging with new test data at 12.5 mg Fe/ml (CNR = 16). C: Test sample concentration reduced to 50% of the calibration sample (CNR = 14). D: 4-voxel images at 1 cm depth using a 12.5 mg Fe/ml mNP sample (CNR = 23).

