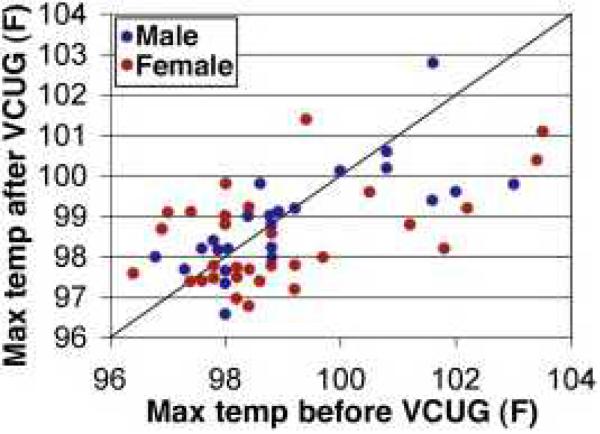
Figure 1.
Scatter graph comparing maximum temperatures of inpatients over 12 h before and after VCUG testing. Differences in median maximal temperature between the 12 h prior to the VCUG (98.6 °F, range 96.4–103.5 °F) and 12 h after the VCUG (98.5 °F, range 96.6–102.8 °F) were not statistically significant (P = 0.492).

