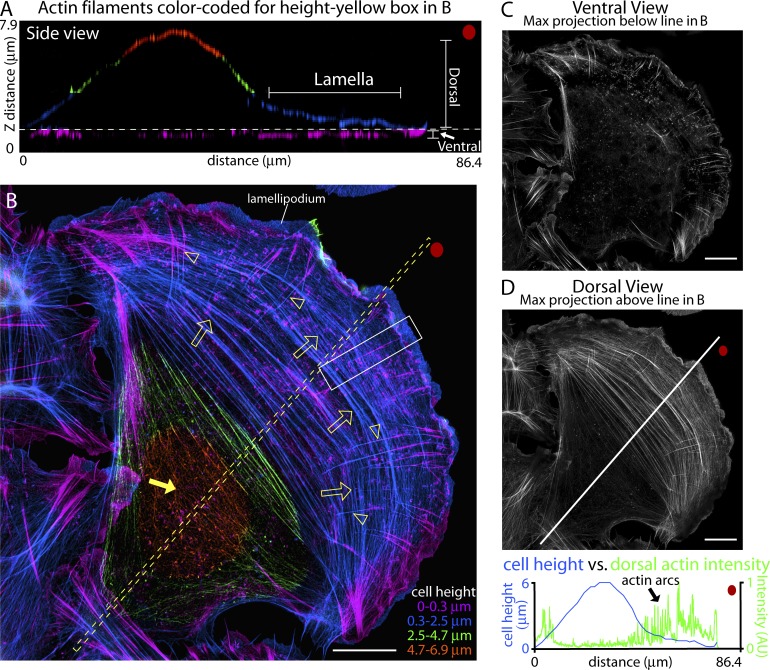
Figure 2.
SIM can resolve actin arcs on the dorsal surface of the lamella. (A–E) 3D SIM of actin filaments in a U2OS cell. (A) Side view from the region of interest denoted by the box in B. Red dots show orientation. The bottom focal plane (purple) is similar to a total internal reflection fluorescence (TIRF) microscopy image. Subsequent 2.2-µm sections above the bottom focal plane are labeled blue, green, and orange, respectively. (B) x-y view of colored layers in A. Arrowheads denote DSFs and open arrows denote actin arcs. The closed arrow denotes actin on top of the cell body. Intensity levels of each section in A and B were normalized so that structure throughout the cell could be displayed in a single image irrespective of relative intensity. (C) Maximum projection of the ventral actin filaments from below the yellow broken line in B. (D) Maximum projection of dorsal actin filaments from above the dotted line in B. The graph plots the intensity of dorsal actin filaments (green line) against cell height (blue line) along the region from the line in B. Bars, 10 µm.

