
Figure 4.
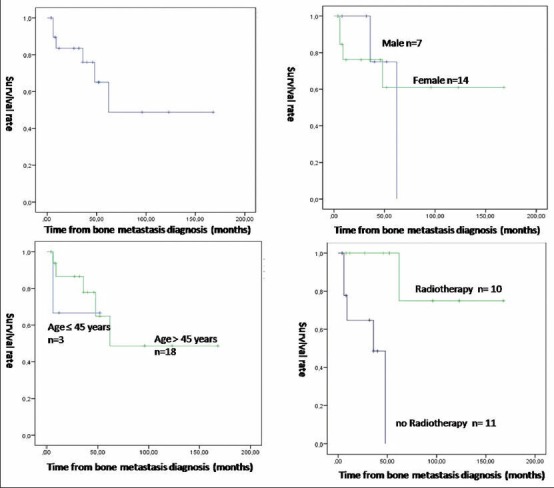
Survival curves using Kaplan-Meier method and Log-rank test. (a) Overall survival curve. (b) Comparison of survival between male and female (P = 0.015). (c) Comparison of survival between patients aged ≤45 years and patients aged >45 years (P = 0.176). (d) Comparison of survival between patients having radiotherapy on metastatic sites and patients who did not (P < 0.001)