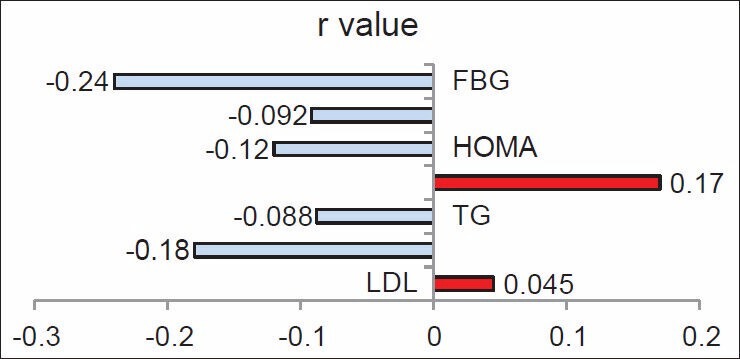
Figure 4.

Correlation between serum adiponectin and lipid profile and glycemic status. FBG, fasting blood glucose; HOMA, Homeostasis Model Assessment; TG, triglycerides; LDL, low-density lipoprotein

Correlation between serum adiponectin and lipid profile and glycemic status. FBG, fasting blood glucose; HOMA, Homeostasis Model Assessment; TG, triglycerides; LDL, low-density lipoprotein