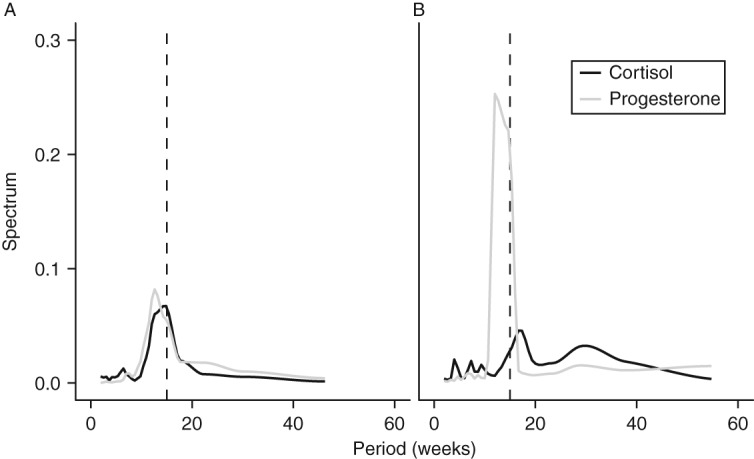
Figure 2.

Spectral analysis plot for identifying cyclic patterns in two representative elephants. (A) F1 shows distinct peak at frequencies near 15 weeks (indicated by dashed line) for both cortisol and progesterone. (B) F2 has a distinct progesterone peak near 15 weeks and two modest peaks for cortisol, one around 15 weeks and another near 30 weeks.

 This work is licensed under a