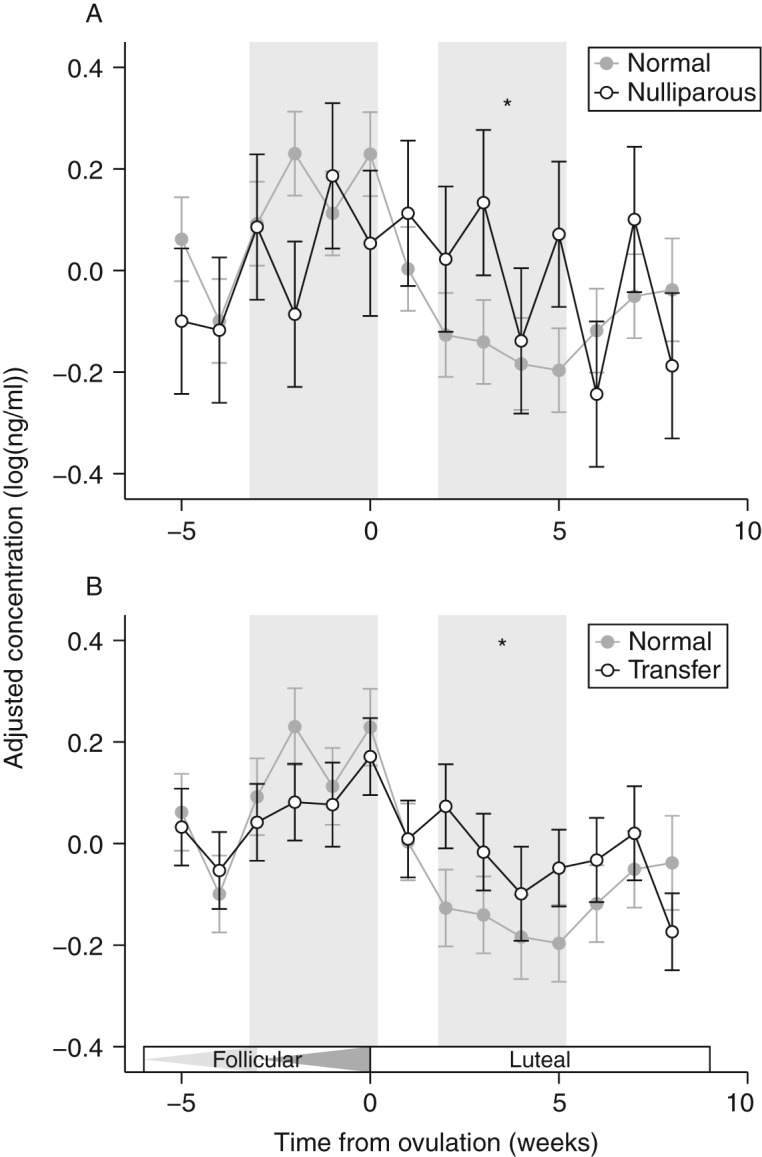
Figure 5.

Cortisol patterns for (A) nulliparous females and (B) females undergoing long-distance transfer. In both graphs, ‘normal’ cortisol patterns (from Fig. 4) are shown in gray for comparison. Data represent mean±1 s.e.m., and are expressed as detrended residuals (see text). Comparisons between groups were made at two time points (indicated by gray bars): the second follicular wave (first bar) and the luteal phase (second bar). Triangles in the 'Follicular' box indicate the first and second follicular waves. Asterisks indicate significant differences between the groups (P<0.05).

 This work is licensed under a