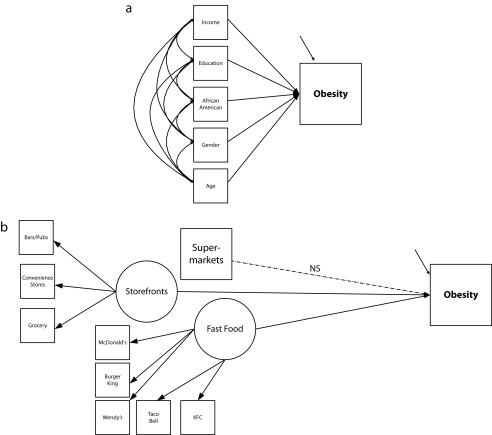
FIGURE 1—
Multilevel structural equation models of individual-level obesity with (a) characteristics at the individual (within) level and (b) food sources at the neighborhood (between) level: Ongoing Research on Aging in New Jersey: Bettering Opportunities for Wellness in Life (ORANJ BOWL), 2006–2008.
Note. NS = not significant. The 2 arrows pointing to Obesity are indicators for the measurement error associated with the observed variable.

