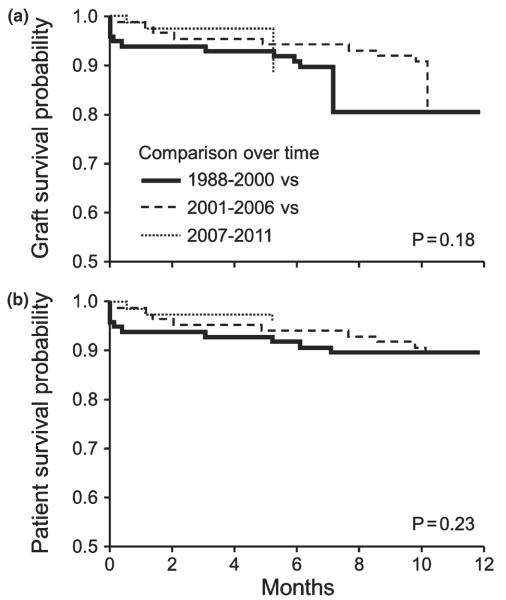
Figure 2.
One-year post liver transplant graft and patient survival among patients with alcoholic cirrhosis. Comparison over time (a–b): 1988–2000 (black dashed line) vs. 2001–2006 (gray dashed line) vs. 2007–2011 (black solid line). Results show that survival for respective time period are similar for graft (89% vs. 89% vs. 96%; Log Rank P = 0.18) and for patient (90% vs. 89% vs. 96%; P = 0.23).

