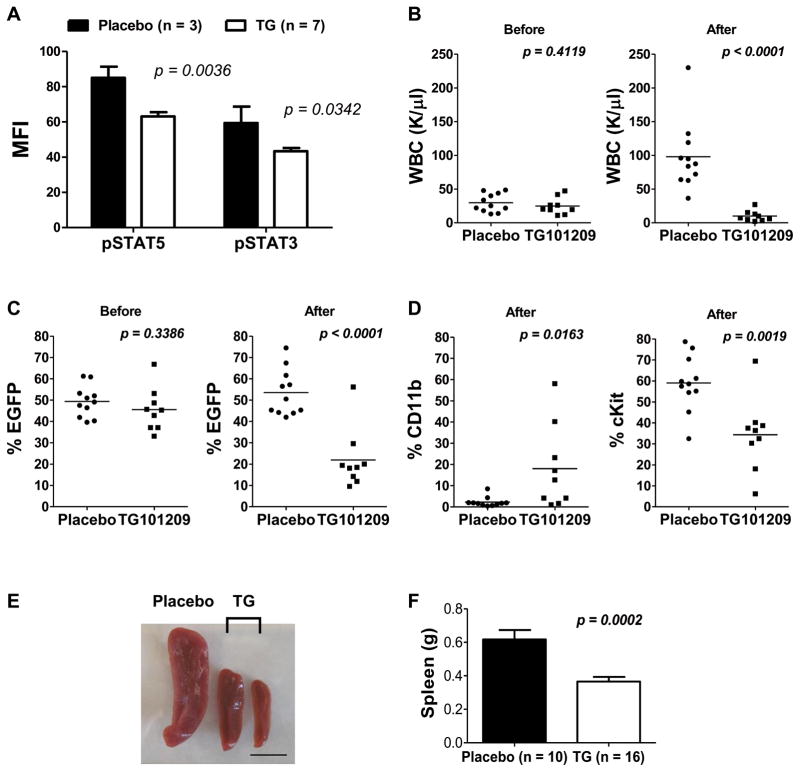
Figure 3. In vivo efficacy of TG101209 on primary transplanted AE9a leukemia mice.
(A) The average mean fluorescence intensity (MFI) (± SEM) of pSTAT5 (Y694) and pSTAT3 (Y705) determined by flow cytometry in spleen cells of AE9a leukemia mice after a single-dose treatment of placebo (n = 3) or TG101209 (100 mg/kg) (n = 7). Cells were harvested 5 hours after treatment. EGFP+ cells were gated for the analysis. (B) Peripheral white blood cell (WBC) counts, and (C) percentages of circulating EGFP+ cells in placebo (n = 11) or TG101209-treated (100 mg/kg, twice daily) (n = 9) mice before (left panel) and after (right panel) two weeks of treatment. (D) Percentages of circulating CD11b+ cells (left panel) and cKit+ cells (right panel) within the EGFP+ population in placebo (n = 11) or TG101209-treated (100 mg/kg, twice daily) (n = 9) mice after two weeks of treatment. Horizontal bars indicate the mean values. (E) Spleens from one AE9a leukemia mouse treated with placebo (left) and two AE9a leukemia mice treated with TG101209 (100 mg/kg) (middle and right) once daily for two weeks. The scale bar is 1 cm. (F) The average spleen weight (± SEM) of AE9a leukemia mice treated with placebo (n = 10) or TG101209 (100 mg/kg) (n = 16) once daily for two weeks. The results are averages of two independent experiments. Each dot in (B), (C) and (D) represents one mouse. The p values were determined using Student’s t-test.

