
Figure 2.
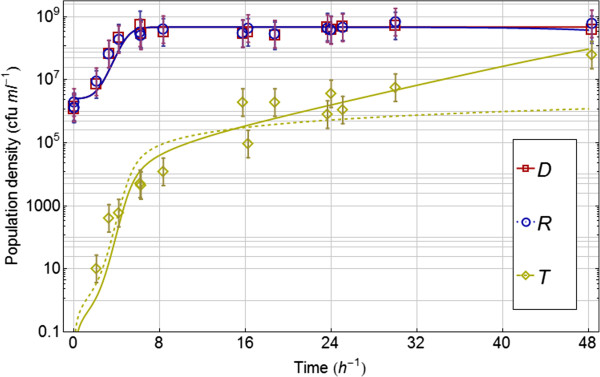
Experimental data on log-scale with 95% confidence intervals from experiments 2a – b with mixed cultures of donor D, recipient R and transconjugant T. The best fitting model (see Table 1) is plotted with solid lines. This is the model without differences in growth parameters between D, R and T and without plasmid loss by the transconjugant T.