
Figure 3.
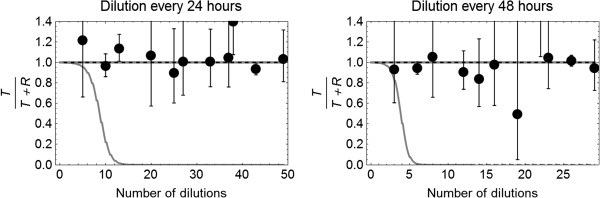
Observed fraction of transconjugants in the bacterial population (T/(T + R) ) from long term experiments 3a and 3b diluting 10,000 times every 24 h (left) or 48 h (right). The dashed black line and coinciding dashed gray line describe the prediction of the simulation model for maximum density KT being a fraction of 0.90 and 0.95 of the maximum density KR The solid gray line describes the prediction for maximum density KT being a fraction of 0.80 of KR.