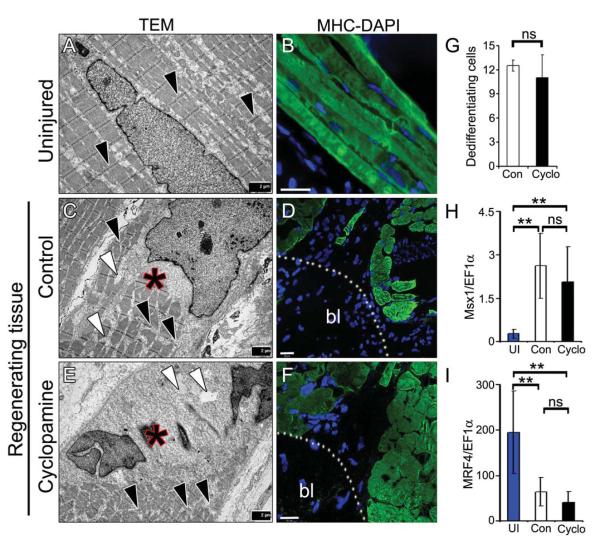
Fig. 3. Inhibition of Hh signaling does not affect the dedifferentiation process.
(A, C, E) TEM images from uninjured (A), control (C) and cyclopamine (E) treated regenerating tissues. Note the loss of Z-lines (black arrowheads) with large intracellular spaces (white arrowheads) in the regenerates. Asterisks indicate a cell undergoing dedifferentiation, evident by partly stained sacromeric structures with altered nuclear architecture in control (C) and cyclopamine (E) treated regenerates. (B, D, F) Myosin heavy chain (MHC) staining (green) from uninjured (B), control (D) and cyclopamine (F) treated regenerating tissues. DAPI (blue) stain the nuclei. Fragmented myofibers stained positive for MHC in the remote area with loss of MHC staining in the blastema (bl) region. Scale bars: 2 μm (A, C, E), 50 μm (B, D, F). (G) Quantification of the dedifferentiated cells (structurally and morphologically altered muscle cells) in the control and cyclopamine treated tissues (n=3; p=0.588). (H, I) qRT-PCR analysis of Msx1 and MRF4 transcripts expression from the regenerating limb tissue at 21d. Note the increased abundance of Msx1 transcript, and reduced expression of MRF4 in the regenerates relative to uninjured group (n=3; **, p<0.005). Error bars indicate s.e.m.

