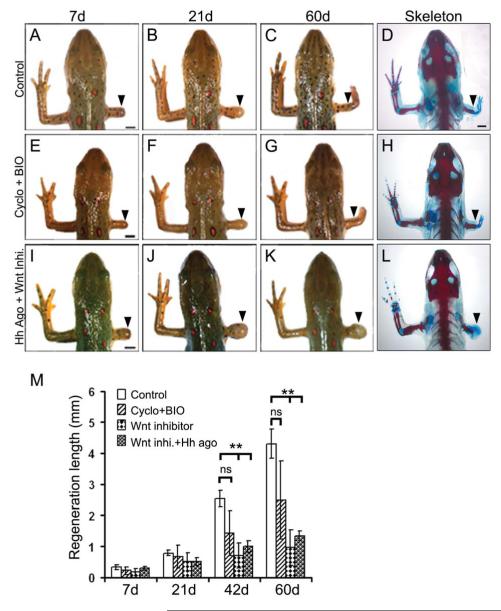
Fig. 7. Wnt signaling functions downstream of Hh signaling during limb regeneration.
(A-L) Whole mount and skeletal micrographs of the regenerates at defined time periods from control (A-D), cyclopamine+BIO (E-H), and Hh agonist+Wnt inhibitor (I L) treated animals. Arrowheads indicate the points of amputation. Note that activating Wnt signaling overrides the effect of Hh inhibition. (M) Quantification of the regenerating limbs from control, cyclopamine+BIO, Wnt inhibitor and Hh agonist+Wnt inhibitor treated animals at specified time points. Data points represent average lengths of the regenerates (n=12 animals; **, p<0.005). Error bars indicate s.e.m. Scale bars: 2 mm.

