Figure 7.
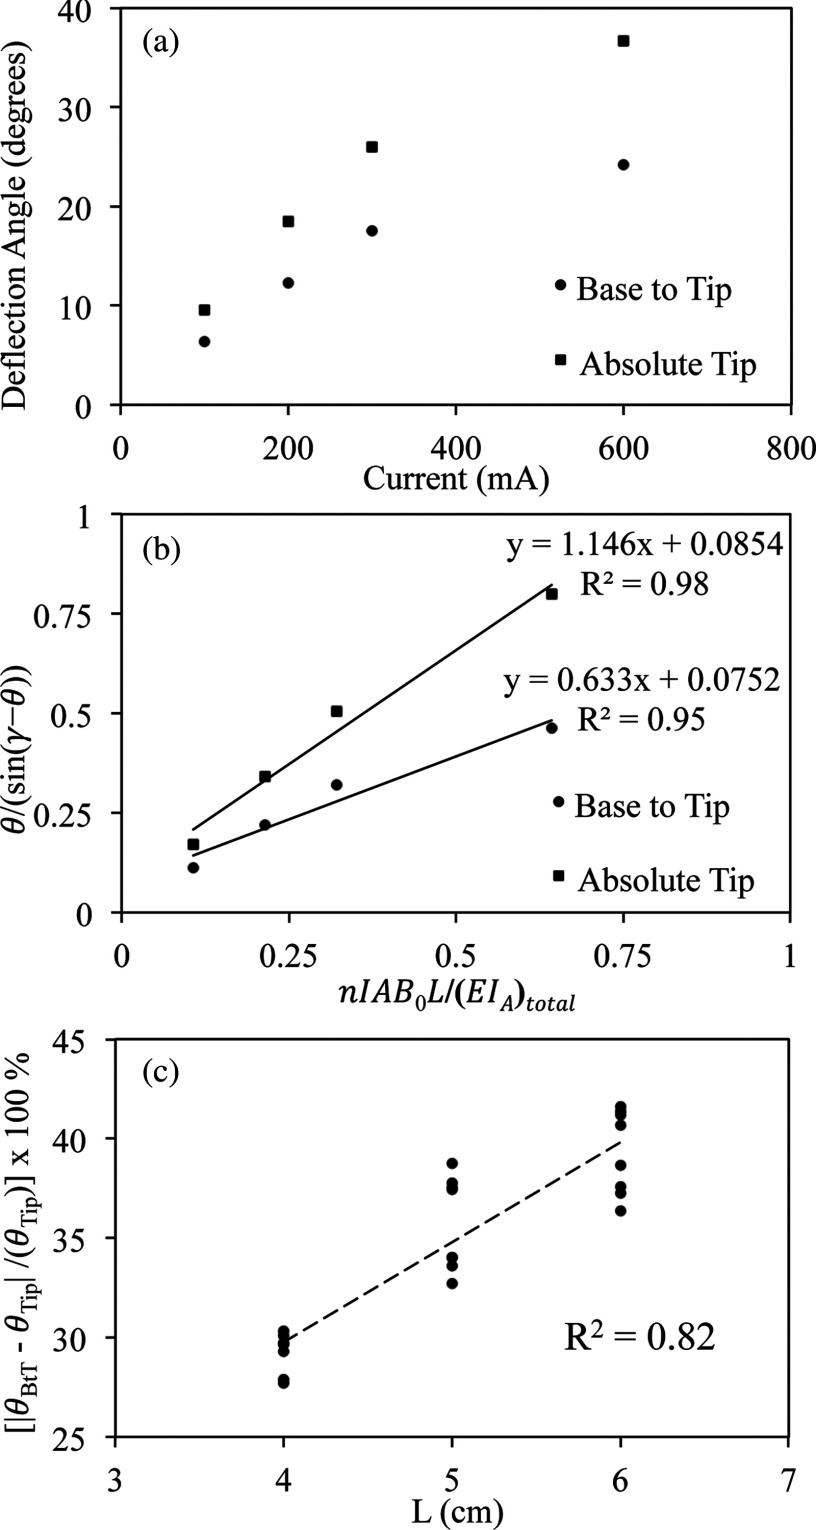
(a) Plot of deflection angle θ as a function of I. Catheter with thermocouple was tested with L equal to 5 cm. Deflection angles measured using base to tip angle method and absolute tip angle method are both shown. (b) Plot of θ/(sin(γ − θ)) as a function of nIAB0L/(EIA)total for both the base to tip and absolute tip method. Again the data are measured for the prototype with the thermocouple with L equal to 5 cm. (c) Plot of the percentage difference between the base to tip angle and absolute tip angle as a function of L. Results from both catheter prototypes are shown on the plot. There is a linear relationship between the percentage difference and L (R2 = 0.82).

