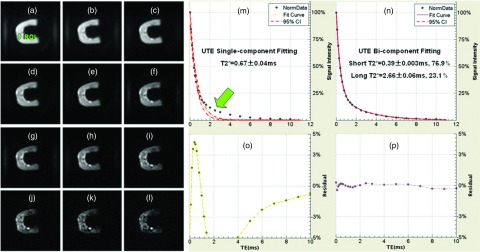
Figure 2.

Selected UTE imaging of a human cortical bone sample with TEs of 10 μs (a), 0.2 ms (b), 0.4 ms (c), 0.6 ms (d), 0.8 ms (e), 1.2 ms (f), 1.6 ms (g), 2.0 ms (h), 3.0 ms (i), 4.0 ms (j), 5.0 ms (k), and 6.0 ms (l), single- (m) and bicomponent (n) fitting with the corresponding fitting residuals (o) and (p). Single-component fitting shows significant residual signal (>10%) (o). The residual signal is reduced to less than 0.5% by bicomponent fitting (p). This gives a shorter T2* of 0.39 ms and a longer T2* of 2.66 ms with respective fractions of 76.9% and 23.1% by volume (N).
