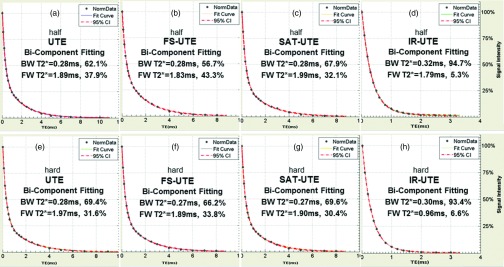
Figure 3.

Bicomponent analysis of UTE images of a bovine bone acquired with a half-excitation pulse (first row) and hard rectangular excitation pulse (second row) without preparation pulse (a) and (e), with a fat saturation pulse (FS-UTE) (b) and (f), a long T2 saturation pulse (SAT-UTE) (c) and (g), and an adiabatic inversion recovery pulse (IR-UTE) (d) and (h). BW and FW represent bound water and free water. CI means the confidence interval. The bicomponent analysis shows that BW T2*s (short T2*s) are similar between half and hard pulses, FW T2*s (long T2*s) ranged from 0.96 to 1.99 ms. The bound water fraction increases from 56.7% with the fat saturation pulse (b), to 62.1% with no preparation pulse (a), to 67.9% with the long T2 saturation pulse (c), and to 94.7% with inversion recovery pulse (d). In the hard pulse excitation group (second row), the bound water fraction followed a similar trend and increased from 66.2% with the fat saturation pulse (f), to 69.4% with no preparation pulse (e), to 69.6% with the long T2 saturation pulse (g), and to 93.4% with inversion recovery pulse (h).
