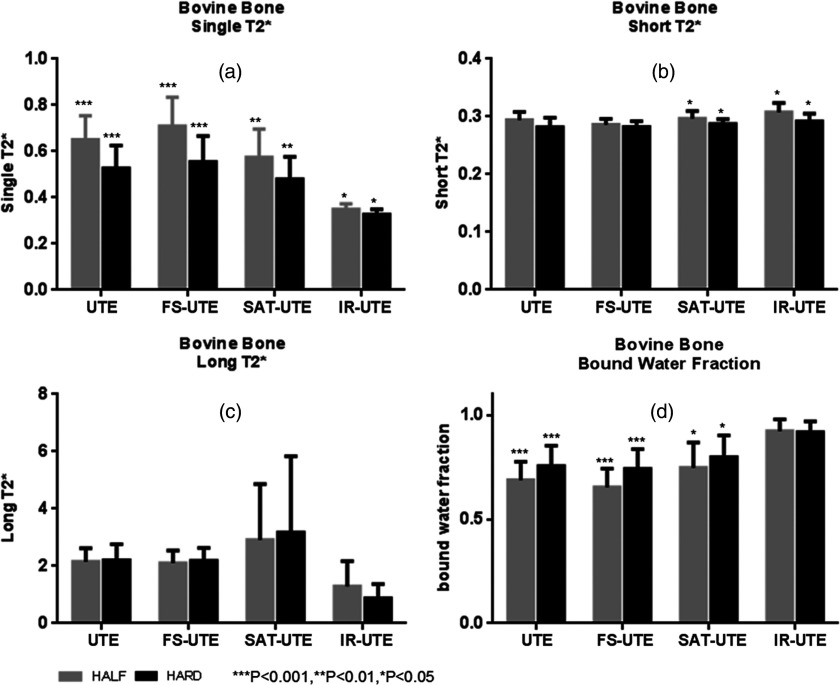
Figure 4.
Summary of all bovine cortical bone samples with mean single component T2*s (a), mean short T2*s (b), mean long T2*s (c), and mean bound water fractions (d). Gray and black rectangular, respectively, present half and hard excitation pulses. The stars on the error bars represented the t-test results of the same group. Single-component analysis demonstrated mean T2*s ranging from 0.33 to 0.71 ms (a) with the different pulse sequences. Bicomponent analysis provided mean short T2*s ranging from 0.28 to 0.31 ms (b), mean long T2*s ranging from 0.87 to 3.17 ms (c), and bound water fractions ranging from 65.3% to 92.3% (d) across the eight different acquisition modes.

