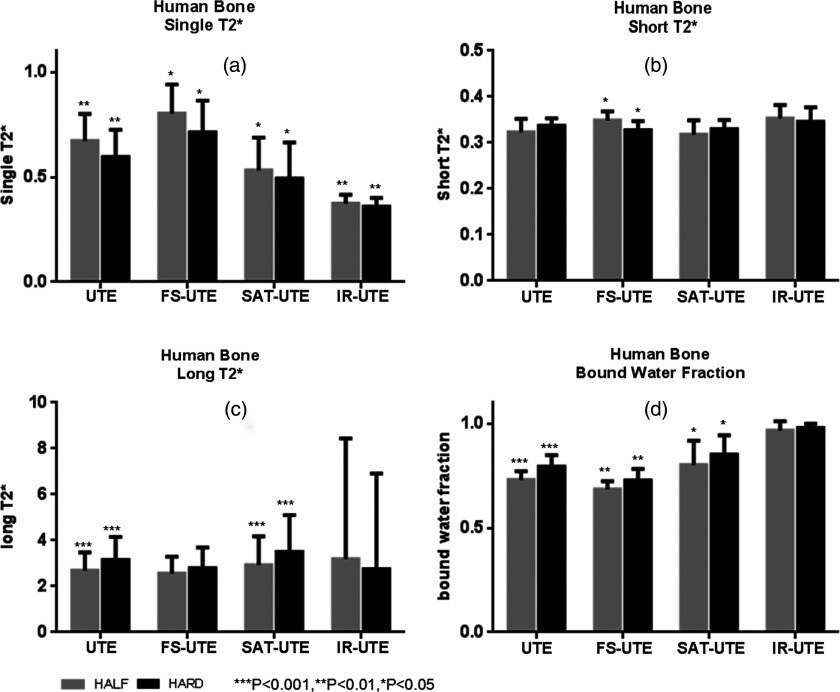
Figure 5.
Summary of all human cortical bone samples with mean single component T2*s (a), mean short T2*s (b), mean long T2*s (c), and mean bound water fractions (d). Gray and black rectangular, respectively, represent half and hard excitation pulses. The stars on the error bars represent the t-test results of the same group. Single-component analysis demonstrated T2*s ranging from 0.38 to 0.79 ms (a) with the different pulse sequences. Bicomponent analysis provided mean short T2*s ranging from 0.31 to 0.36 ms (b), mean long T2*s ranging from 1.56 to 2.14 ms (c), and bound water fractions ranging from 64.8% to 95.1% (d) across the eight different acquisition modes.

