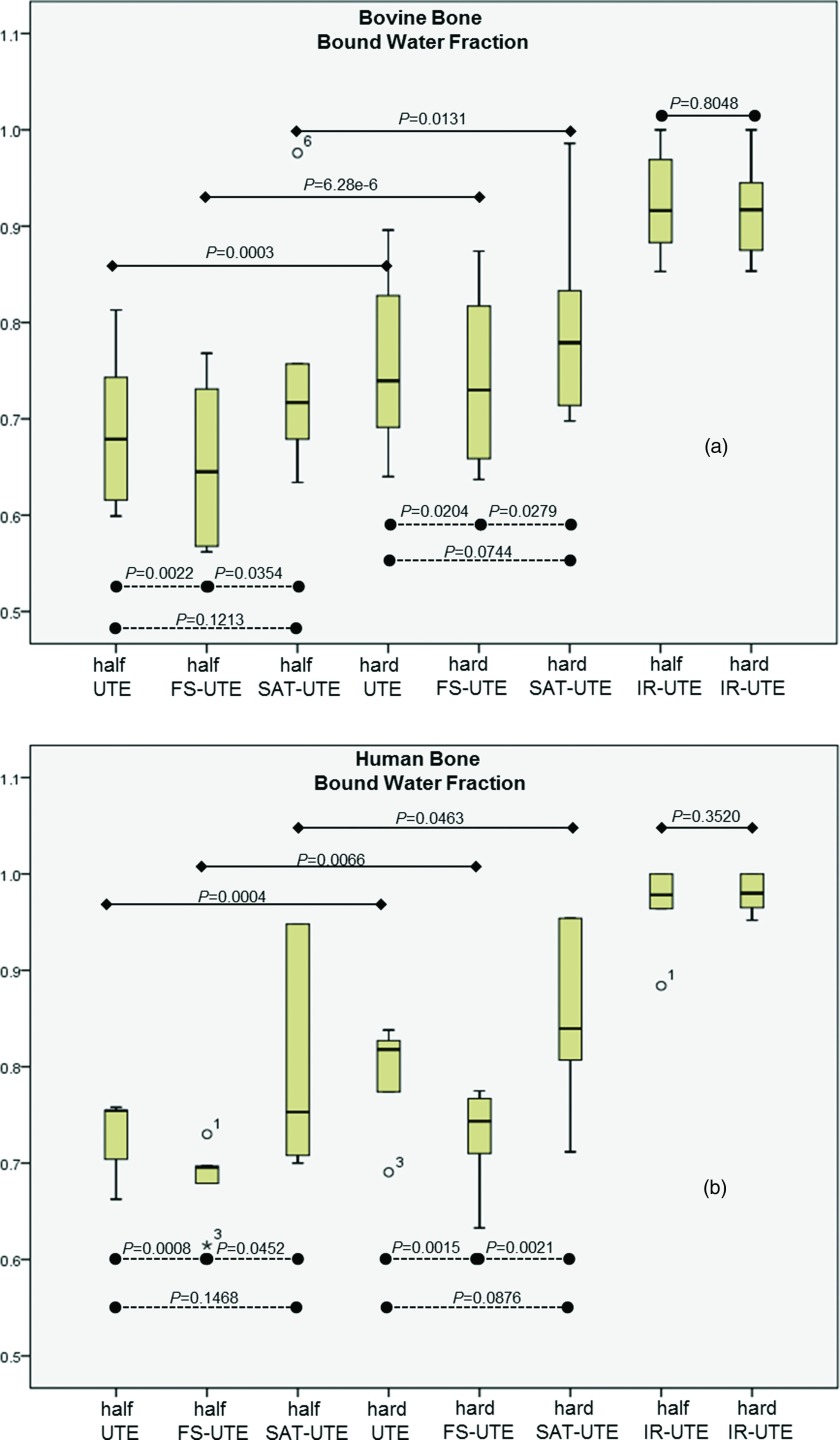
Figure 6.
Box plot showing the bound water fraction in bovine (a) and human (b) cortical bone samples. Solid lines represent the comparison results between half and hard pulses, while the dotted lines represent the comparison between different preparation pulse. In two groups of bones, two-tailed t-test found the bound water fraction had significant differences between half UTE and half FS-UTE, half FS-UTE and half SAT-UTE, hard UTE and hard FS-UTE, and hard FS-UTE and hard SAT-UTE (all with p values < 0.05).

