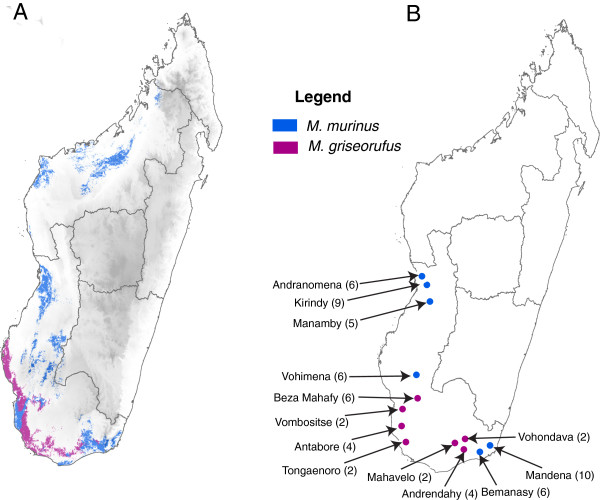
Figure 1.
Ranges and sampling information for all Microcebus murinus and M. griseorufus used in this study. A) Map of Madagascar illustrating potential geographic ranges of Microcebus murinus and M. griseorufus based on species distribution modeling in Maxent. Ranges are visualized on a digital elevation model for Madagascar. Maxent models were performed by J.L. Brown and used with permission. B) Sampling information for individuals used in this study. Values in parentheses represent number of individuals included per locality.

