Figure 1.

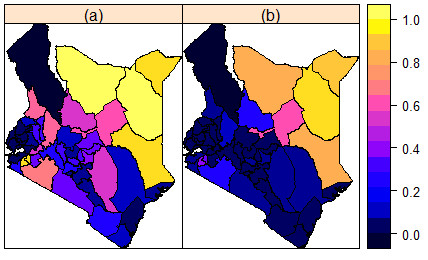
Observed (Crude) county level prevalence maps. (a) Prevalence of FGM/C. (b) Proportion of women in support of FGM/C continuation.

Observed (Crude) county level prevalence maps. (a) Prevalence of FGM/C. (b) Proportion of women in support of FGM/C continuation.