
Figure 2.
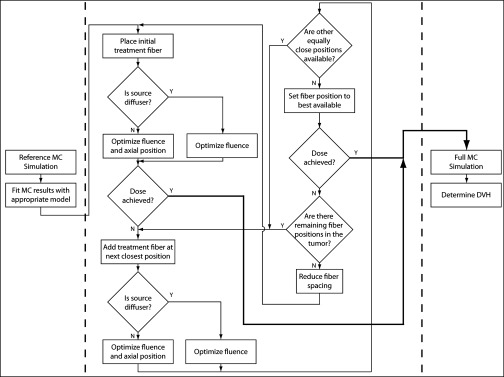
Block diagram illustrating the treatment planning algorithm. The three major components of the process are separated by dotted lines, and the thick black lines represent satisfactory treatment plans.
Official websites use .gov
A
.gov website belongs to an official
government organization in the United States.
Secure .gov websites use HTTPS
A lock (
) or https:// means you've safely
connected to the .gov website. Share sensitive
information only on official, secure websites.
Block diagram illustrating the treatment planning algorithm. The three major components of the process are separated by dotted lines, and the thick black lines represent satisfactory treatment plans.