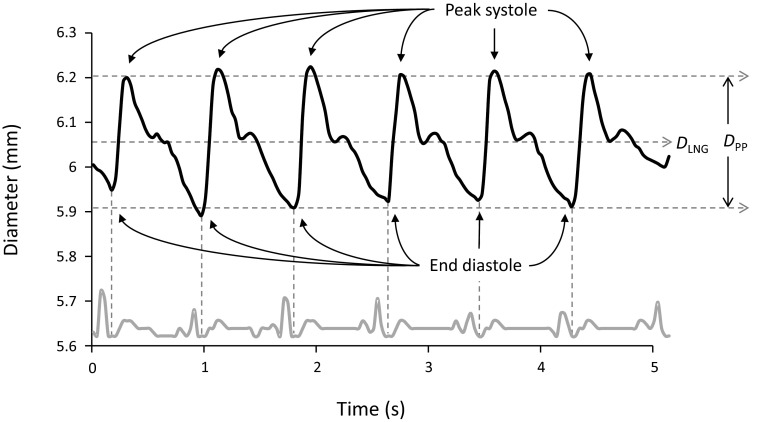
Figure 4.
Diameter of the brachial artery from longitudinal ultrasound images. The upper waveform shows the automatically calculated diameter of the brachial artery from ultrasound video acquired in longitudinal view over six cardiac cycles. The lower gray waveform is the ECG recorded simultaneously and then automatically extracted. The minima of the diameter waveform correspond to end diastole. The dicrotic notch at end systole is visible for every cycle. DLNG is mean diameter. The peak-to-peak diameter DPP is a measure of arterial distention, which can be seen to vary slightly with respiration. Over six cardiac cycles, the maximum distention for this artery was 0.3 mm.

