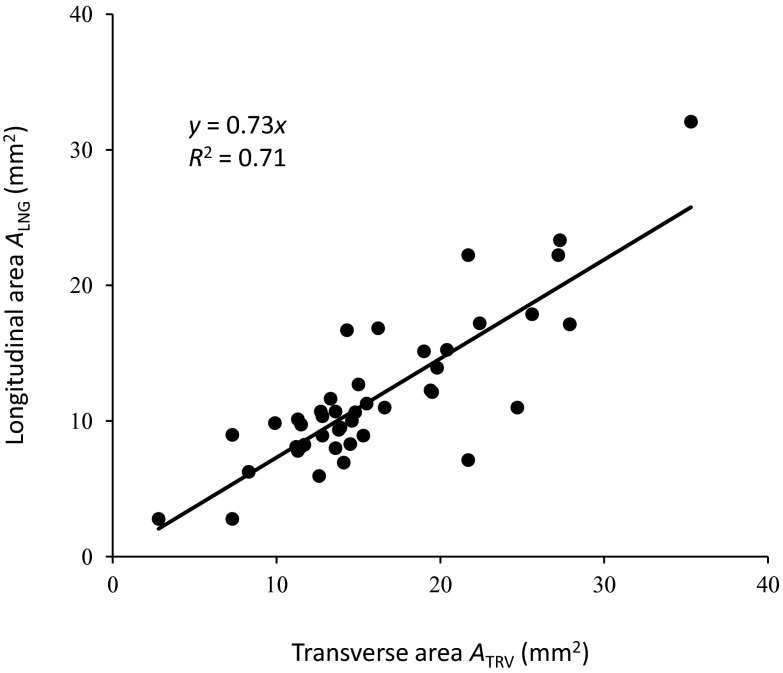
Figure 7.
Comparison of brachial artery cross-sectional area measured from longitudinal and transverse ultrasound images. The transverse (ATRV) and longitudinal area (ALNG) for every case were plotted and fit to the model ALNG = 0.73ATRV. The slope of 0.73 indicates that cross-sectional area derived from longitudinal-view measurement is on average 27% less than transverse-view cross-sectional area. The R2 of 0.71 indicates that the linear model accounts for 71% of the variation.

