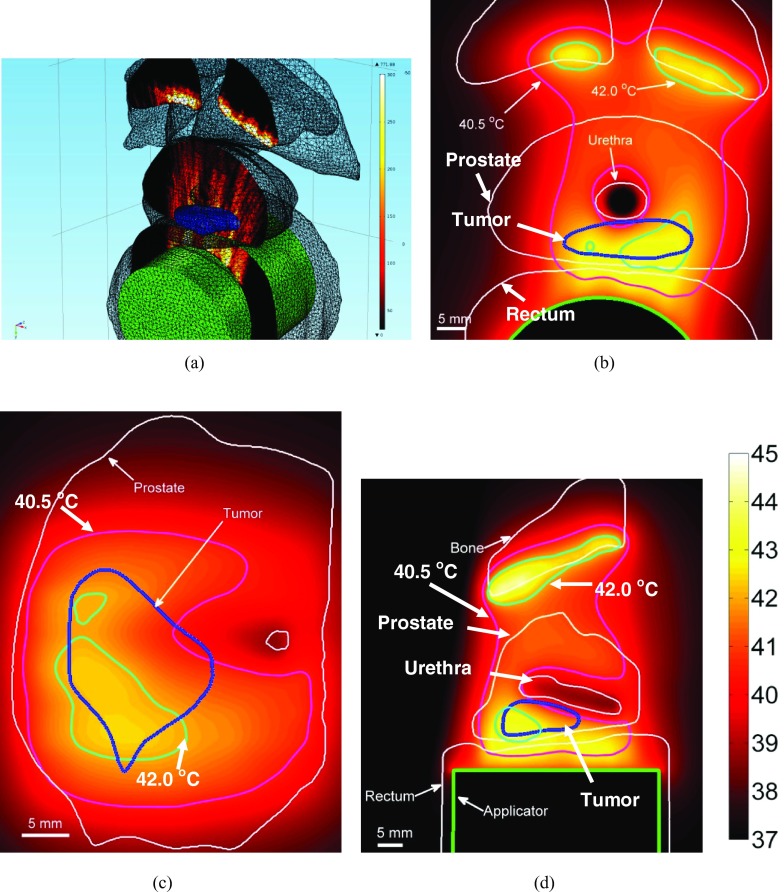
Figure 6.
(a) SAR distribution obtained by cylindrically diverging sonication is plotted in the central axial plane (b) Corresponding temperature distribution obtained in the same central axial plane is shown. Temperature distribution in an oblique sagittal slice (c) and an oblique coronal slice is also shown (I = 1.35 W/cm2, Tmax = 44.8 °C).

