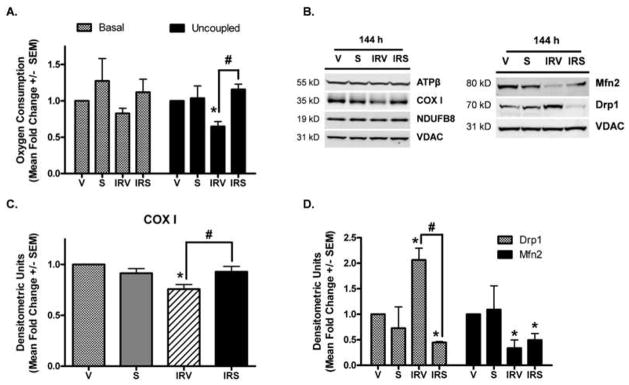
Figure 4. Oxygen consumption and protein expression in isolated mitochondria.

(A) Basal and FCCP-uncoupled respiration were measured in mitochondria isolated from the renal cortex at 144 h (n = 4, Mean fold change +/− SEM). (B) ATP synthase β (ATPβ), cytochrome c oxidase subunit I (COX I), and NDUFB8, and the fusion/fission proteins Mfn2 and Drp1 were examined in mitochondria isolated from the renal cortex at 144 h, with densitometric quantification (normalized to VDAC) in (C) and (D) (n = 3). Asterisks (*) indicate data are significantly different from V group, and pound signs (#) indicate IRS was significantly different from the IRV group (ANOVA followed by Newman-Keuls, p<0.05).
