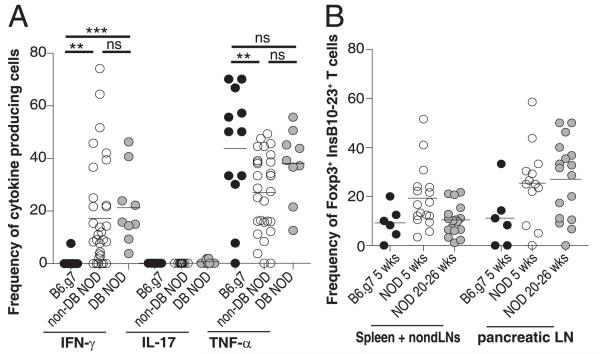
FIGURE 3.
Insulin-specific CD4+ T cells produce the pathogenic cytokine IFN-γ in NOD mice but not B6.g7 mice. (A) Frequency of insulin-specific CD4+ T cells from combined SLOs (Spl+nonDLN+pLN) producing IFN-γ, IL-17A, or TNF-α. Data are compiled from nine experiments with B6.g7 (n = 12), nondiabetic NOD (n = 28), and diabetic NOD (n = 9) mice. (B) Frequency of Foxp3+ insulin-specific CD4+ T cells in B6.g7 mice at 5 wk (n = 6), NOD mice at 5 wk (n = 17), and NOD mice at 20–26 wk (n = 17). Data are compiled from six experiments. Cells were gated on singlet+, B220−, CD11b−, CD11c−, CD4+, CD8a−, InsB10–23r3:I-Ag7-PE+ , and InsB10–23r3:I-Ag7-allophycocyanin+. **p = 0.001–0.01, ***p < 0.001. ns, Not significant.

