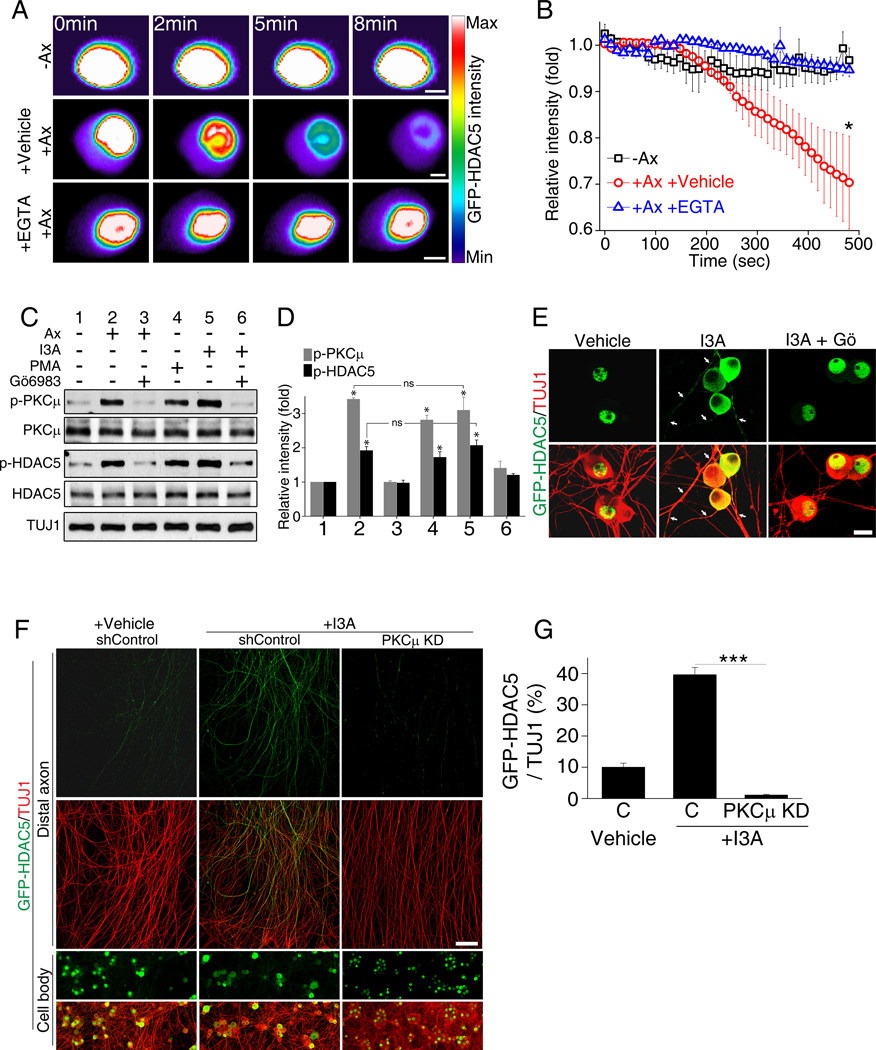
Figure 2. Axotomy induces HDAC5 nuclear export through PKCµ activation.
(A) Intensity profiles of GFP-HDAC5-expressing DRG cell bodies. GFP-HDAC5 intensity in DRG cell body was monitored over time with or without laser axotomy in the presence or absence of 1mM EGTA. Scale, 5µm. (B) Average intensity plot of nuclear GFP-HDAC5 (−Ax, without axotomy; +Ax +Vehicle, with axotomy treated with vehicle; +Ax +EGTA, with axotomy treated with EGTA; n=4, 5 and 4 for each; *p<0.05). (C) Cultured DRG neurons were treated as indicated for 1 hour and analyzed by western blot. (I3A, ingenol 3-angelate, 50 nM; PMA, phorbol 12-myristate 13-acetate, 10 µM). (D) Quantification of (C) (n=5; *p<0.05; ns, not significant). (E) DRG neurons expressing GFP-HDAC5 were treated with vehicle, 50nM I3A or I3A with 10µM Gö6983 for 1 hour and stained for TUJ1 antibody. Scale, 50µm. Arrowheads: TUJ1 positive axons. (F) DRG spot cultures expressing GFP-HDAC5 were infected with control shRNA or PKCµ shRNA and treated with vehicle or 5 nM I3A, as indicated. Cell body and axon areas were analyzed. Scale,100µm. (G) Quantification of GFP-HDAC5 intensity normalized to TUJ1 intensity (C, shControl; PKCµ KD, PKCµ shRNA; n=15, 12 and 10 for each; ***p<0.001). Data are represented as mean±SEM. See also Figure S1.

