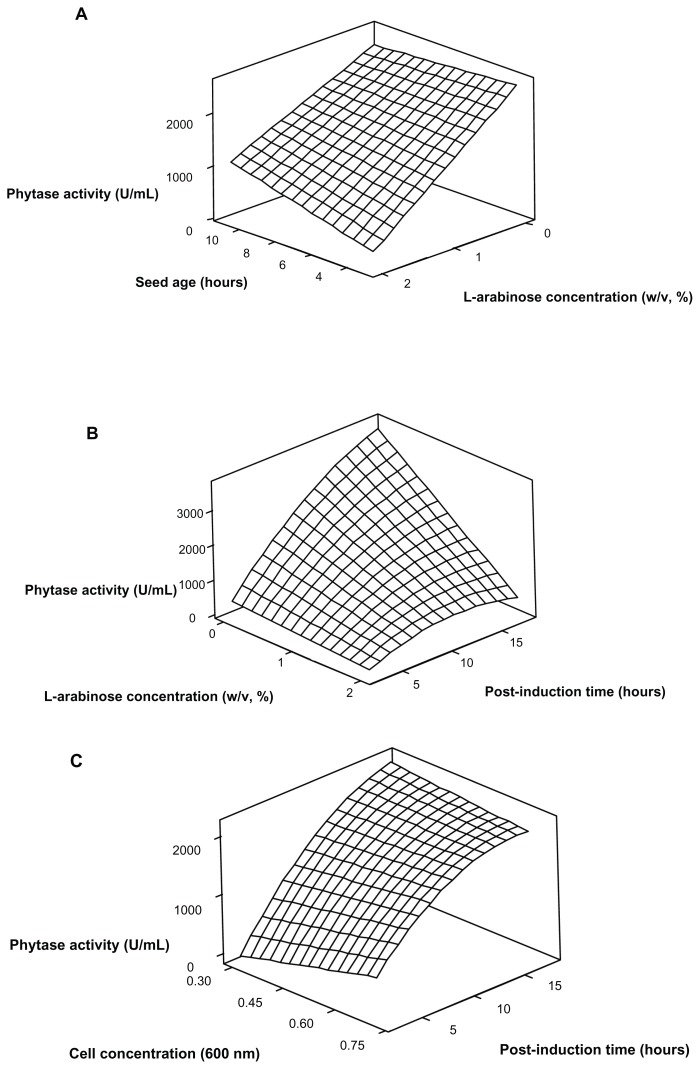
Figure 3.
Response surface graphs for the phytase production by optimizing the cultivation condition: (A) Interaction between seed age and L-arabinose concentration while other factors were kept at their central level. (B) Interaction between L-arabinose concentration and post-induction time (h) while other factors were kept at their central level. (C) Interaction between induction time (by measuring cell concentration at 600 nm) and post-induction time while other factors were kept at their central level.

