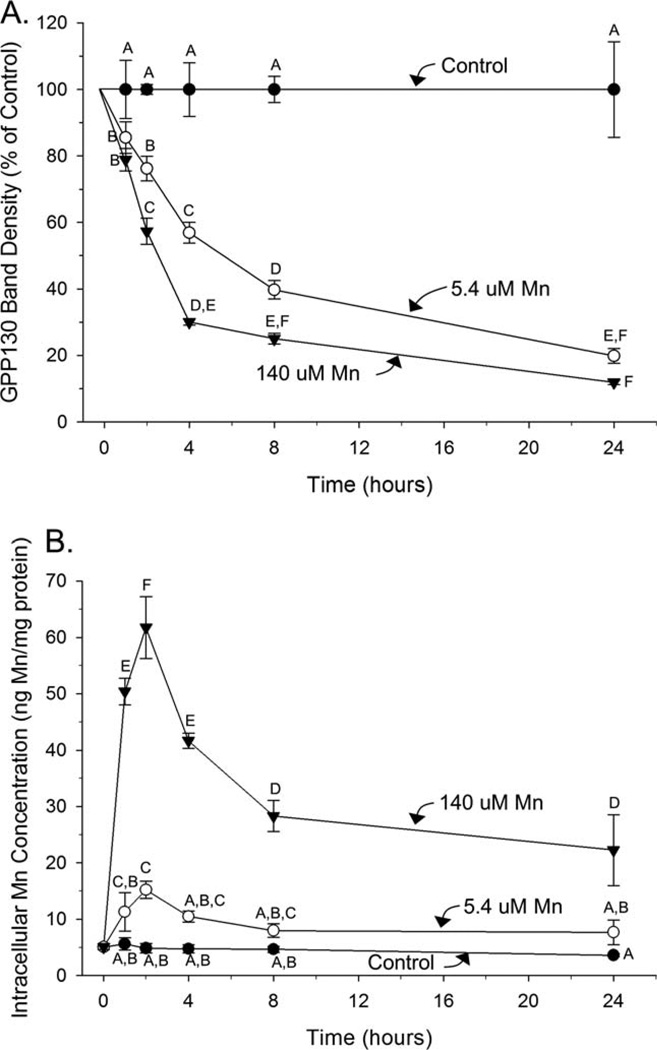
Fig. 3.
GPP130 degradation occurs rapidly with a parallel rapid increase then decrease in intracellular Mn concentrations over time. A: Cellular GPP130 levels by Western blot, a percent of control, in AF5 cells treated for 1, 2, 4, 8, or 24 h with control (0.09 µM), 5.4 µM, or 140 µM Mn. B: Intracellular Mn concentrations measured by ICP-MS in AF5 cells under the same conditions. Data are mean (±SD, n=3/treatment) from a representative experiment performed in triplicate. Superscript letters denote significant differences between treatment groups; bars that do not share a common superscript are statistically different from one another (P<0.05), based on Tukey’s post hoc test.

