
Figure 1. Gr-1 and Ly6C/Ly6G markers identify similar populations of monocytes and macrophages in the mouse spleen.
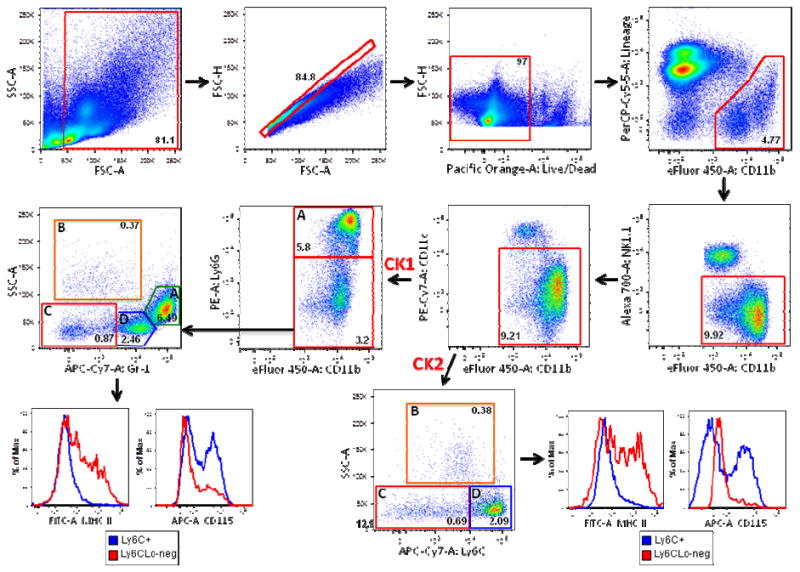
Total mouse splenocytes from C57BL/6 mice were prepared as described in Materials and Methods. Debris (SSC-A vs. FSC-A) and doublets (FSC-H vs. FSC-A) were excluded and live/dead discrimination was determined using the amine reactive dye Aqua (FSC-H vs. Pacific Orange-A Live/Dead). CD11b+Lineage- cells (gated out using a CD4, CD8, CD19 PerCP-Cy5.5 dump channel) were then sub-gated on CD11b+NK1.1- cells, followed by excluding CD11cHi cells. For the first cocktail (CK1), 4 subpopulations were identified: A) Gr-1HiSSCInt cells (neutrophils) and B) Gr-1Lo-negSSCHi cells (eosinophils) were negative for MHC Class II and CD115 staining (Supplemental Figure 5) C) Gr-1Lo-negSSCLo cells (monocytes/macrophages) were MHC Class II+/-CD115- (red histogram) D) Gr-1+SSCLo cells (monocytes/macrophages) were MHC Class II-CD115+/- (blue histogram). For the second cocktail (CK2), 4 subpopulations were identified: A) Ly6GHiCD11b+ cells (neutrophils) and B) Ly6CLo-negLy6G-SSCHi cells (eosinophils) were negative for MHC Class II and CD115 (Supplemental Figure 5) C) Ly6CLo-negLy6G-SSCLo cells (monocytes/macrophages) were MHCII+/-CD115- (red histogram) D) Ly6C+Ly6G-SSCLo cells (monocytes/macrophages) were MHC Class II-CD115+/- (blue histogram). Frequencies of cells in each sub-gate (after debris and doublet exclusion) are expressed as a percentage of live cells.