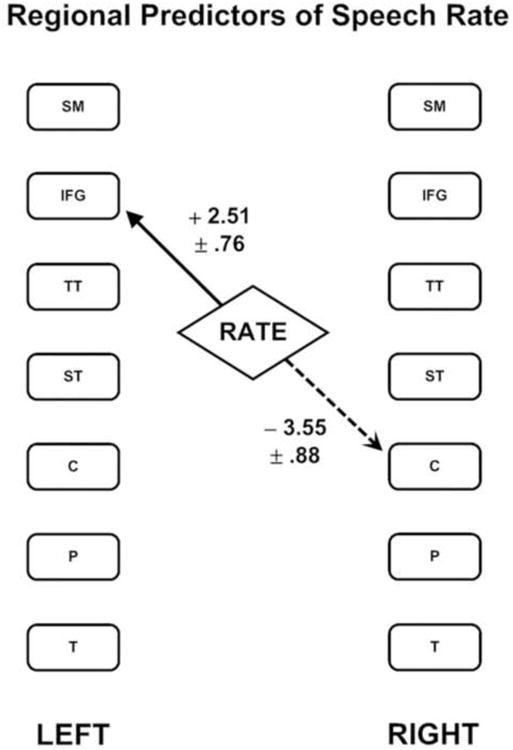
Figure 1.

The two brain regions that combine to predict syllable repetition rate as identified by multiple linear regression using a stepwise selection process. The solid line represents a positive regression weight while the dashed line represents a negative regression weight. The values listed are the unstandardized regression coefficients plus or minus one standard error. The following regions are represented: sensori-motor cortex (SM); inferior frontal gyrus (IFG); transverse temporal cortex (TT); superior temporal cortex (ST); caudate nucleus head (C); putamen (P); thalamus (T).
