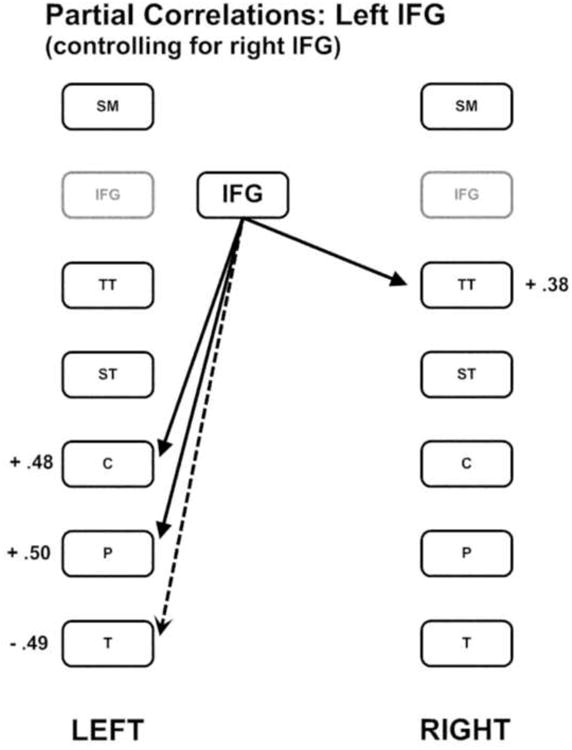
Figure 2.

The pattern of partial correlations between the left inferior frontal gyrus region and the remaining brain regions controlling for the right inferior frontal gyrus region. Positive correlations are indicated by solid lines and negative correlations are indicated by dashed lines.
