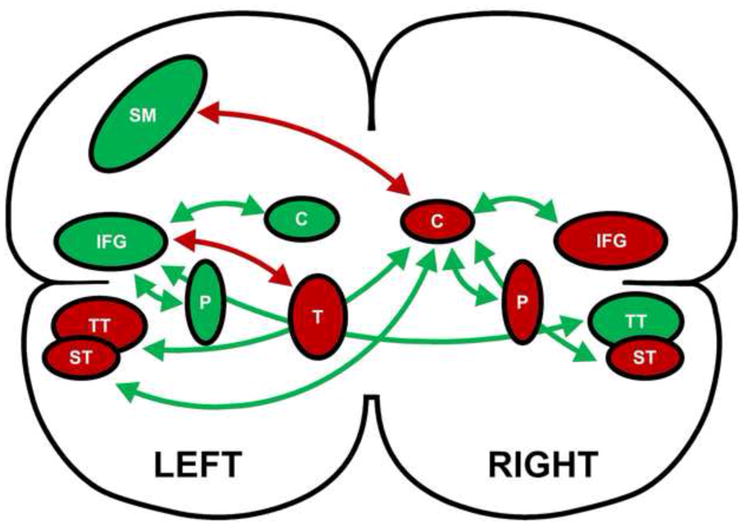
Figure 4.

Schematic depiction of the inter-relationships among brain regions and their relationships to speech rate. The arrows represent the partial correlations among brain regions, with green depicting positive correlations and red depicting negative correlations. The green brain regions have a positive relationship with speech rate while the red regions have a negative relationship with speech rate. The regions are as follows: inferior frontal gyrus (IFG); sensori-motor cortex (SM); transverse temporal cortex (TT); superior temporal cortex (ST); caudate nucleus (C); putamen (P); and thalamus (T). The left inferior frontal gyrus and the right caudate nucleus have a primary association with speech rate while the other brain regions have a secondary relationship.
