
Fig. 1.
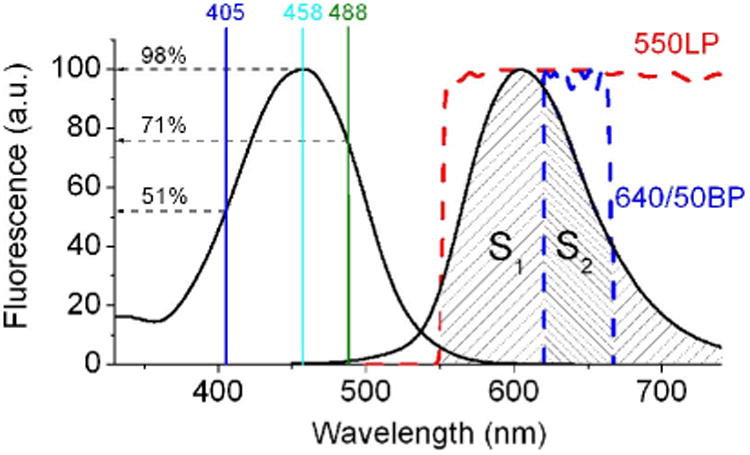
The fluorescence excitation and emission spectra of LSSmKate2 (solid lines) are shown. The wavelengths of the laser lines, 405, 458, and 488 nm, are shown by vertical lines with indication of excitation efficiency. The emission that passes through the 550 nm long pass (red dash line) and 640/50 nm band pass (blue dash line) filters is shown as cross-hatched region with square S1 and S2, respectively. The fluorescence intensity collected through the filters is proportional to the S1 and S2 squares. (For interpretation of the references to color in this figure legend, the reader is referred to the Web version of this chapter.)