
Fig. 3.
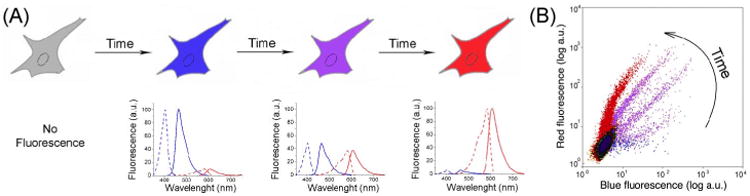
(A) A cell expressing a fluorescent timer gradually changes fluorescence from blue to red with time. The respective time changes of the excitation and emission spectra for the blue and red forms of the fluorescent timer are shown. (B) A flow cytometry plot shows the same population of cells, which expresses the blue-to-red fluorescent timer, analyzed at different times after its expression. (For interpretation of the references to color in this figure legend, the reader is referred to the Web version of this chapter.)