
Figure 1.
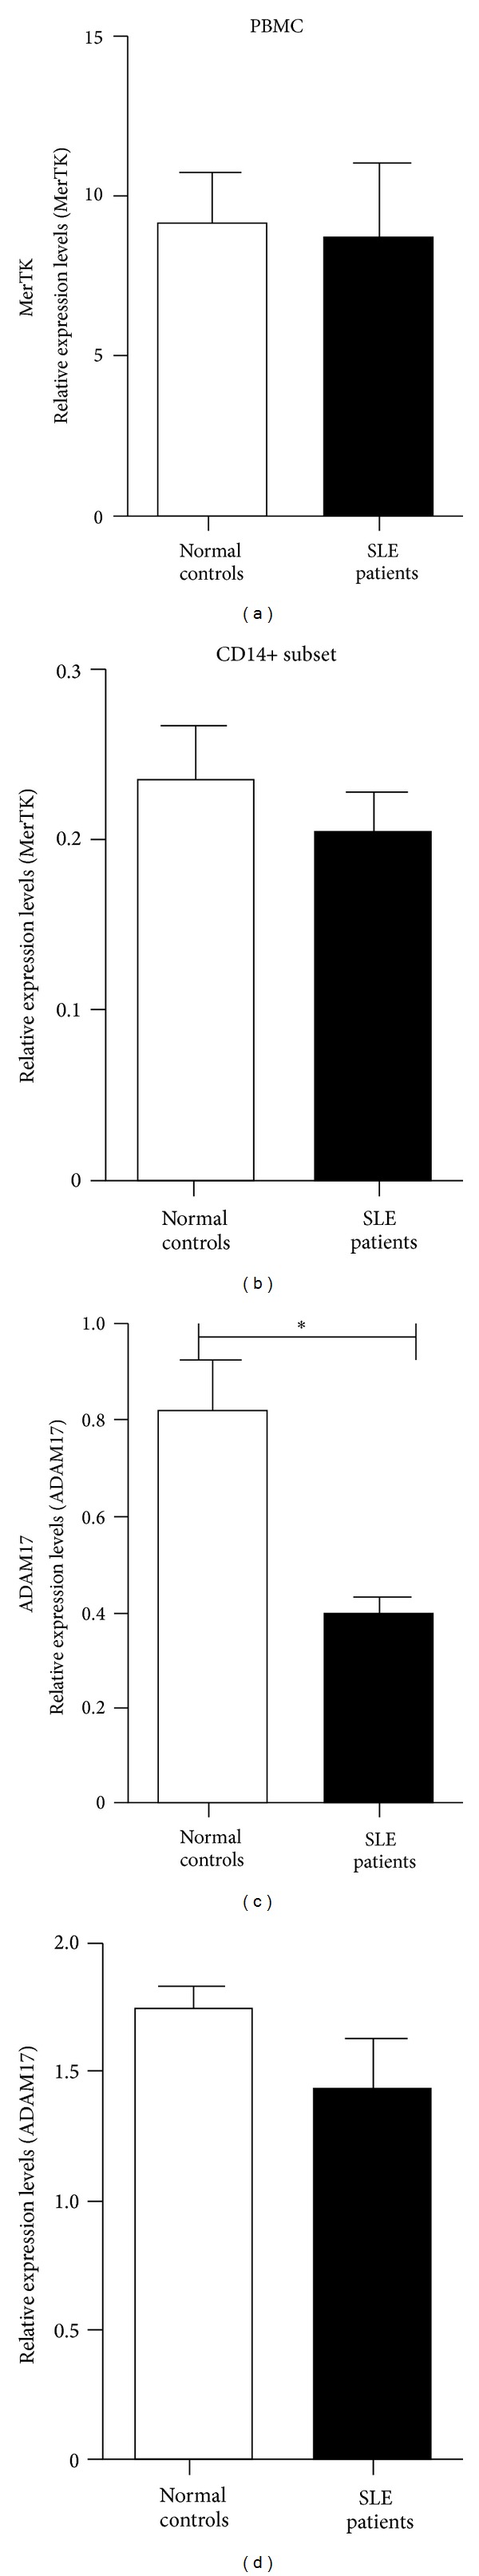
Comparison of gene expressions in PBMC (26 healthy controls and 35 SLE patients for MerTK; 6 healthy controls and 6 SLE patients for ADAM17) and CD14+ monocytes/macrophages. Relative MerTK expression levels in PBMC and CD14+ are shown in (a) and (b), respectively. (c) and (d), respectively, demonstrated the ADAM17 expression in PBMC and CD14+ monocytes/macrophages. Histograms in solid show the relative gene expression in SLE patients compared with expression in healthy controls (histogram in blank). Vertical lines out histograms show standard errors. PBMC: peripheral blood mononuclear cell; MerTK: Mer tyrosine kinase; ADAM17: A Disintegrin And Metalloproteinases domain 17. *P < 0.05.