
Figure 4.
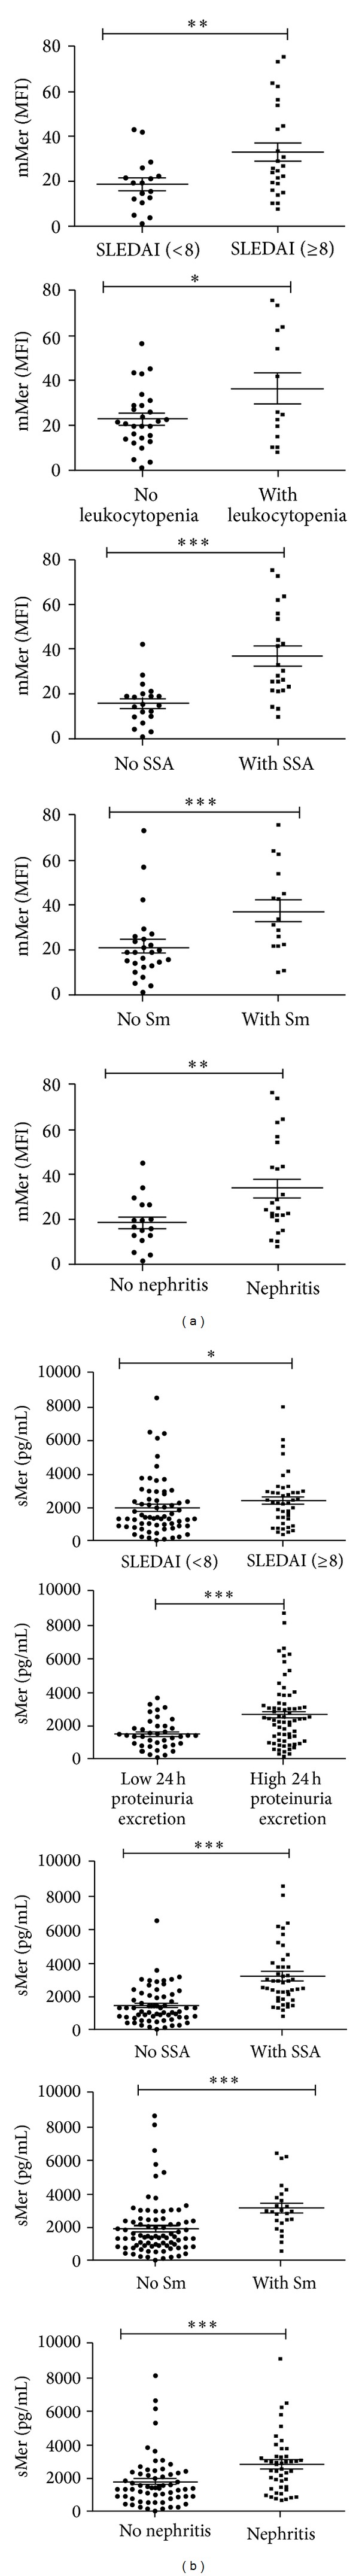
mMer and sMer levels according to the clinical manifestations in SLE. (a) mMer expression on CD14+ monocytes/macrophages in patients with a SLEDAI more than or equal to 8, WBC less than 4 × 10⁹/L, and with SSA, Sm or lupus nephritis. (b) Plasma sMer concentrations in patients with a SLEDAI more than or equal to 8, 24 h proteinuria excretion more than or equal to 0.1 g/d, and with SSA, Sm or lupus nephritis. SLEDAI = SLE disease activity index. WBC: leukocytes; SSA: anti-SSA antibody; Sm: anti-Sm antibody. Circles in solid and in blank represented the mMer or sMer levels in the presence and absence of manifestations in SLE with the studied parameters, respectively. Horizontal lines above dots showed difference. *P < 0.05, **P < 0.01, ***P < 0.001.