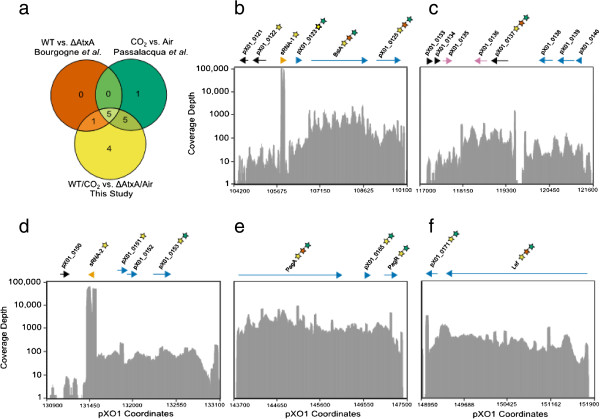
Figure 2.
Regions containing genes in virulence condition synergy group and comparisons to previous data. (a) Venn diagram showing the overlap between the number of genes on pXO1 whose expression were significantly upregulated in two previous studies [12,27] vs. those from the current study. (b-f) Plots displaying representative count data of one of the two WT/CO2 sample (Sample 2, Table 1) along indicated regions of pXO1 transformed to a log base-2 scale. The y-axis is normalized to the highest expression on pXO1 and remains the same for all five plots. Colors indicate the class of gene: blue for protein-coding genes considered to be in operons, purple for pseudogenes, orange for sRNAs, and black for the remaining protein-coding genes. The longest open reading frame (for protein-coding genes) or transcript boundaries (for sRNAs) are mapped above the plots. Stars mark the genes whose expression were upregulated in Bourgogne et al. (red), Passalacqua et al. (green), and this study (yellow). Note that these five plots are not an exhaustive representation of all genes upregulated on pXO1 and so do not enumerate all genes counted in (A).

