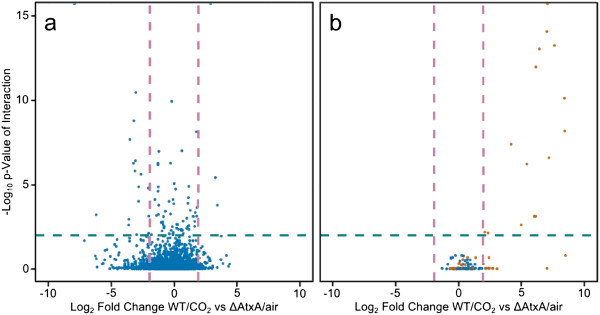
Figure 4.
Distribution of expression changes in WT/CO2 samples and p-values of the interaction effect. Scatter plots showing the joint distribution of fold-change between WT/CO2 and ΔAtxA/air (transformed to a log base-2 scale) and p-values of the likelihood ratio test for the genotype by environment interaction (transformed to a negative log base-10 scale) on the chromosome (a) and pXO1 (b). Only genes above the 30th percentile of total expression are included. The teal dotted line shows the adjusted p-value cutoff at 0.01. For pXO1, genes in the 58.9-kb extended pathogenicity island are colored in orange.

